I’ve had an idea kicking around at the back of my mind for years and finally spent a few hours over the last couple of weekends building it. It’s a probabilistic spreadsheet.
In a rush? Direct link to demo.
You might recognize the building blocks of this project - it was cool to realize how easy it was to extend my basic spreadsheet to make it do something at least vaguely remarkable - LALR parser generators for the win!
Every possible outcome, built right in
If you’ve ever made a spreadsheet model you’ve probably spent hours fiddling around with different values for each of the inputs to get a sense of which ones matter most - how sensitive the output is to each of the inputs. Maybe you filled a whole column with different values of a sensitive variable to see the likely range of outcomes for your thing? Well, with this probabilistic spreadsheet the whole range of possible values is built right in. You can directly express how you believe the values will be distibuted and every possible scenario is modeled for you every time. It lets you assign probability distributions as values. That means each cell in the spreadsheet can contain a probability distribution instead of regular numbers or formulae. You can use cells in math expressions whether they contain a scalar or a distribution. When two distributions are combined, a Monte Carlo simulation runs to generate a new probability distribution in the result cell. You can even combine distributions by choosing the maximum among samples (e.g. if you want to model latency waiting on multiple processes) or by randomly choosing a value from each. There are also built in functions to turn distributions into scalars (e.g. by computing the mean value or the Nth percentile). The end result is quite powerful.
Example - Drake Equation
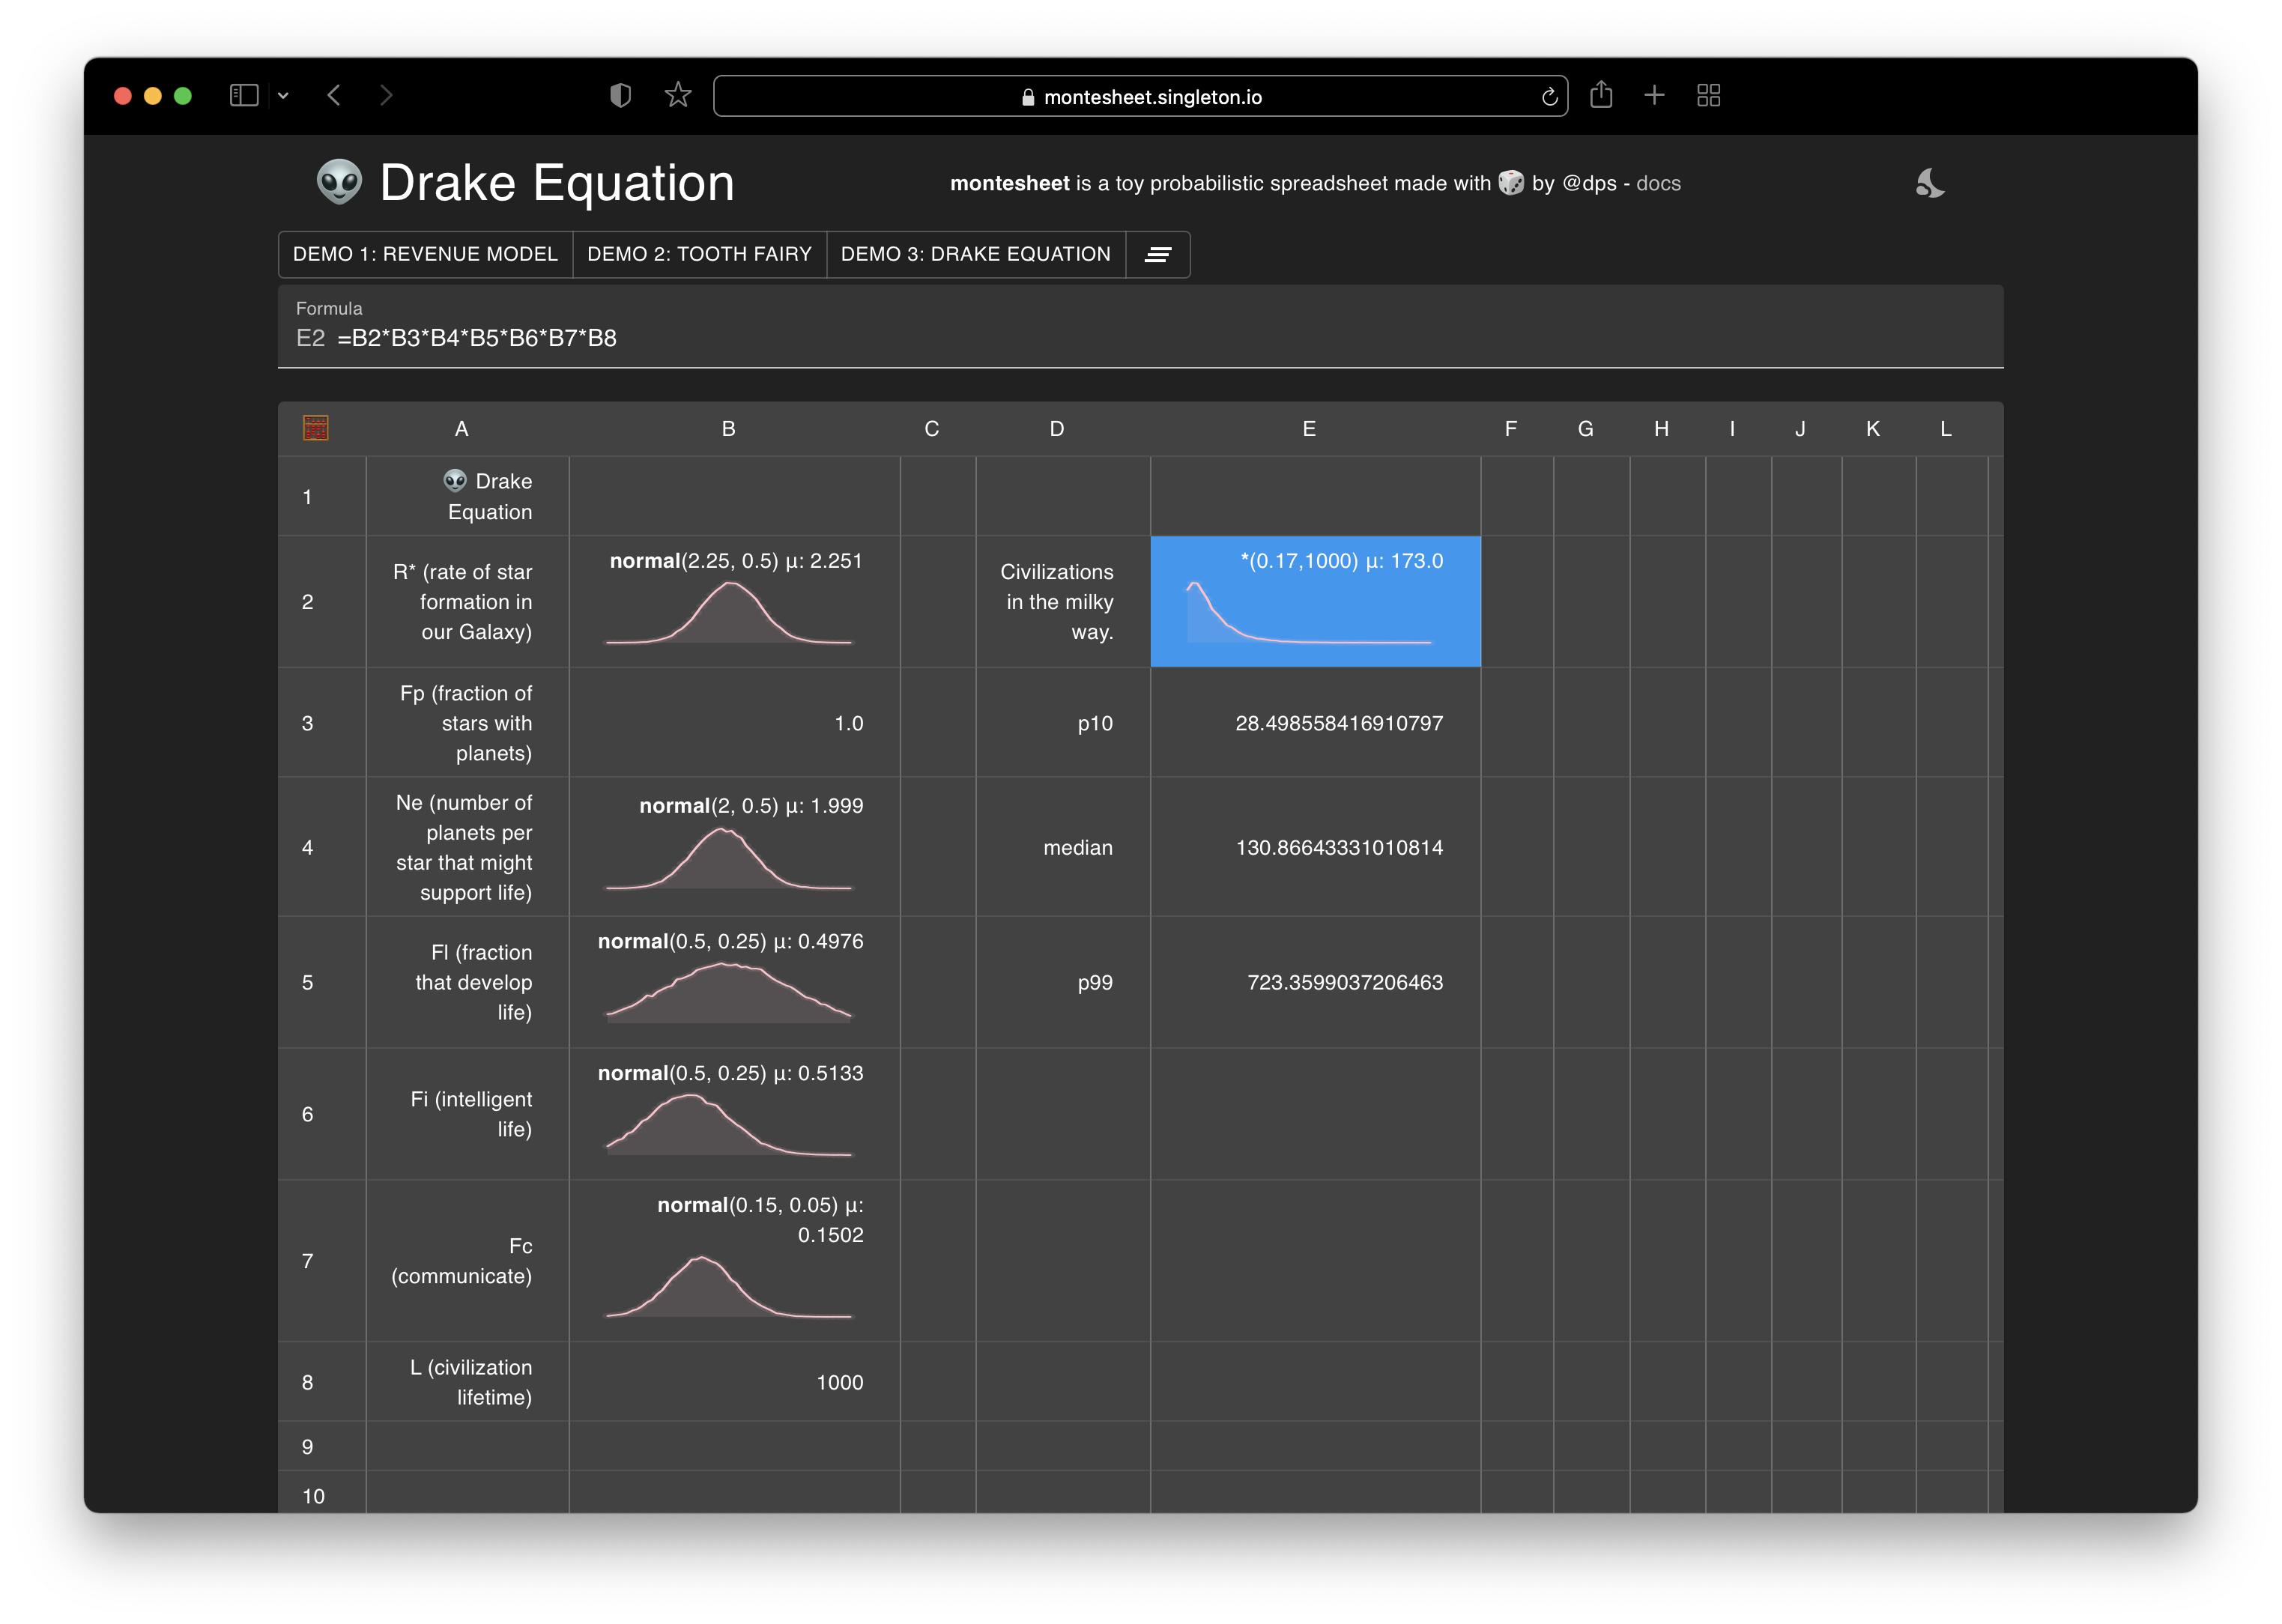
Here’s an example - the Drake Equation tells us how many alien civilizations we might be able to detect in the Milky Way. Here’s how it works (courtesy wikipedia):
The Drake equation is:
N = R∗ * fp * ne * fl * fi * fc * L
where:
N = the number of civilizations in our galaxy with which communication might be possible
and
R∗ = the average rate of star formation in our Galaxy
fp = the fraction of those stars that have planets
ne = the average number of planets that can potentially support life per star that has planets
fl = the fraction of planets that could support life that actually develop life at some point
fi = the fraction of planets with life that actually go on to develop intelligent life (civilizations)
fc = the fraction of civilizations that develop a technology that releases detectable signs of their existence into space
L = the length of time for which such civilizations release detectable signals into space
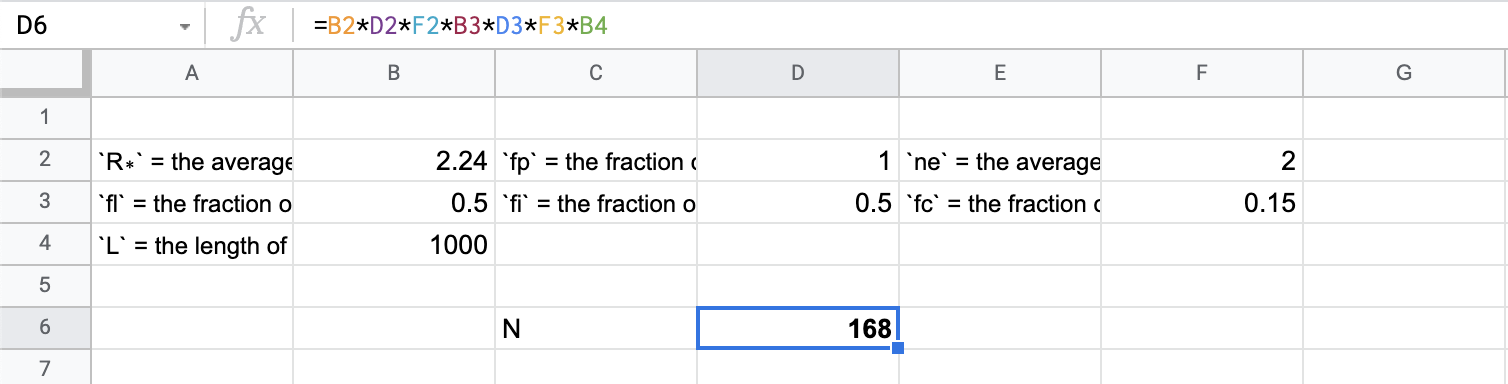
You can easily put together a spreadsheet model, plug in the most likely currently accepted values of all these terms and you’ll find that the number of such civilizations right now is about 170 (that’s cool, huh!?).
But as you might imagine, there is huge variance in plausible values for each of the terms in this equation. If the fraction of stars with planets turned out to be 50% vs the accepted most probable value of 100% (that’s pretty cool too!) and the fraction of planets that develop life was 10% instead of 50% and finally the fraction of life bearing planets that go on to develop intelligent life was also 10% instead of 50%, then the number of civilizations in today’s Milky Way is not over a hundred but rather… about 3. Hmm…
What we really want to know then is how likely each outcome of the Drake Equation is. Wouldn’t it be great if we could build our understanding of the distribution of each of these terms right into our model?
That’s exactly what you can do with this proof of concept.
Wikipedia says that “calculations in 2010, from NASA and the European Space Agency indicate that the rate of star formation in our Galaxy is about 1.5–3 stars per year.” I put the middle of that range (2.25) in the simple boring-old-regular-spreadsheet model above, but let’s get fancy. 2.25 is the most likely value but we’ll assume (using a bit of intuition) that that’s the mean of a normal distribution with standard deviation in line with a minimum of 1.5 and a maximum of 3. We can assign that whole distribution to a cell in this new spreadsheet with the formula =normal(2.25, 0.3, 1.5, 3)
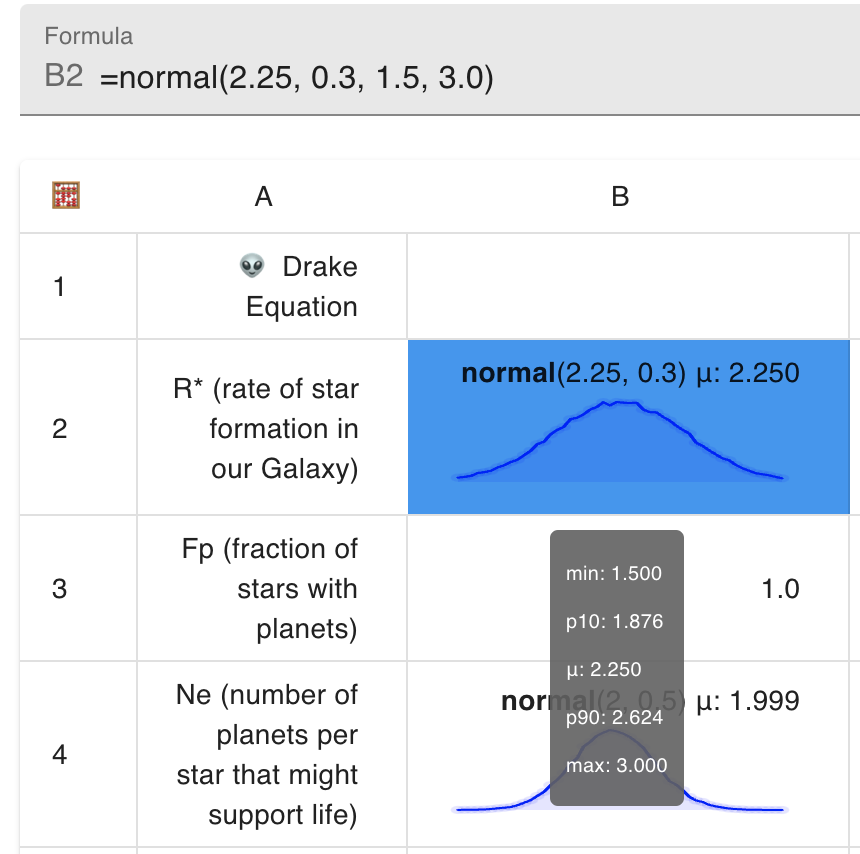
That’s cool! Behind the scenes, this cell now contains not one, but tens of thousands of values all chosen according to that distribution. We can go ahead and specify that the number of planets per star that might support life also follows a normal distribution with a mean of 2, a minimum of 0 (negative numbers of stars would be nonsensical, but no max here) =normal(2, 0.5, 0) etc until we have distributions for all the terms.
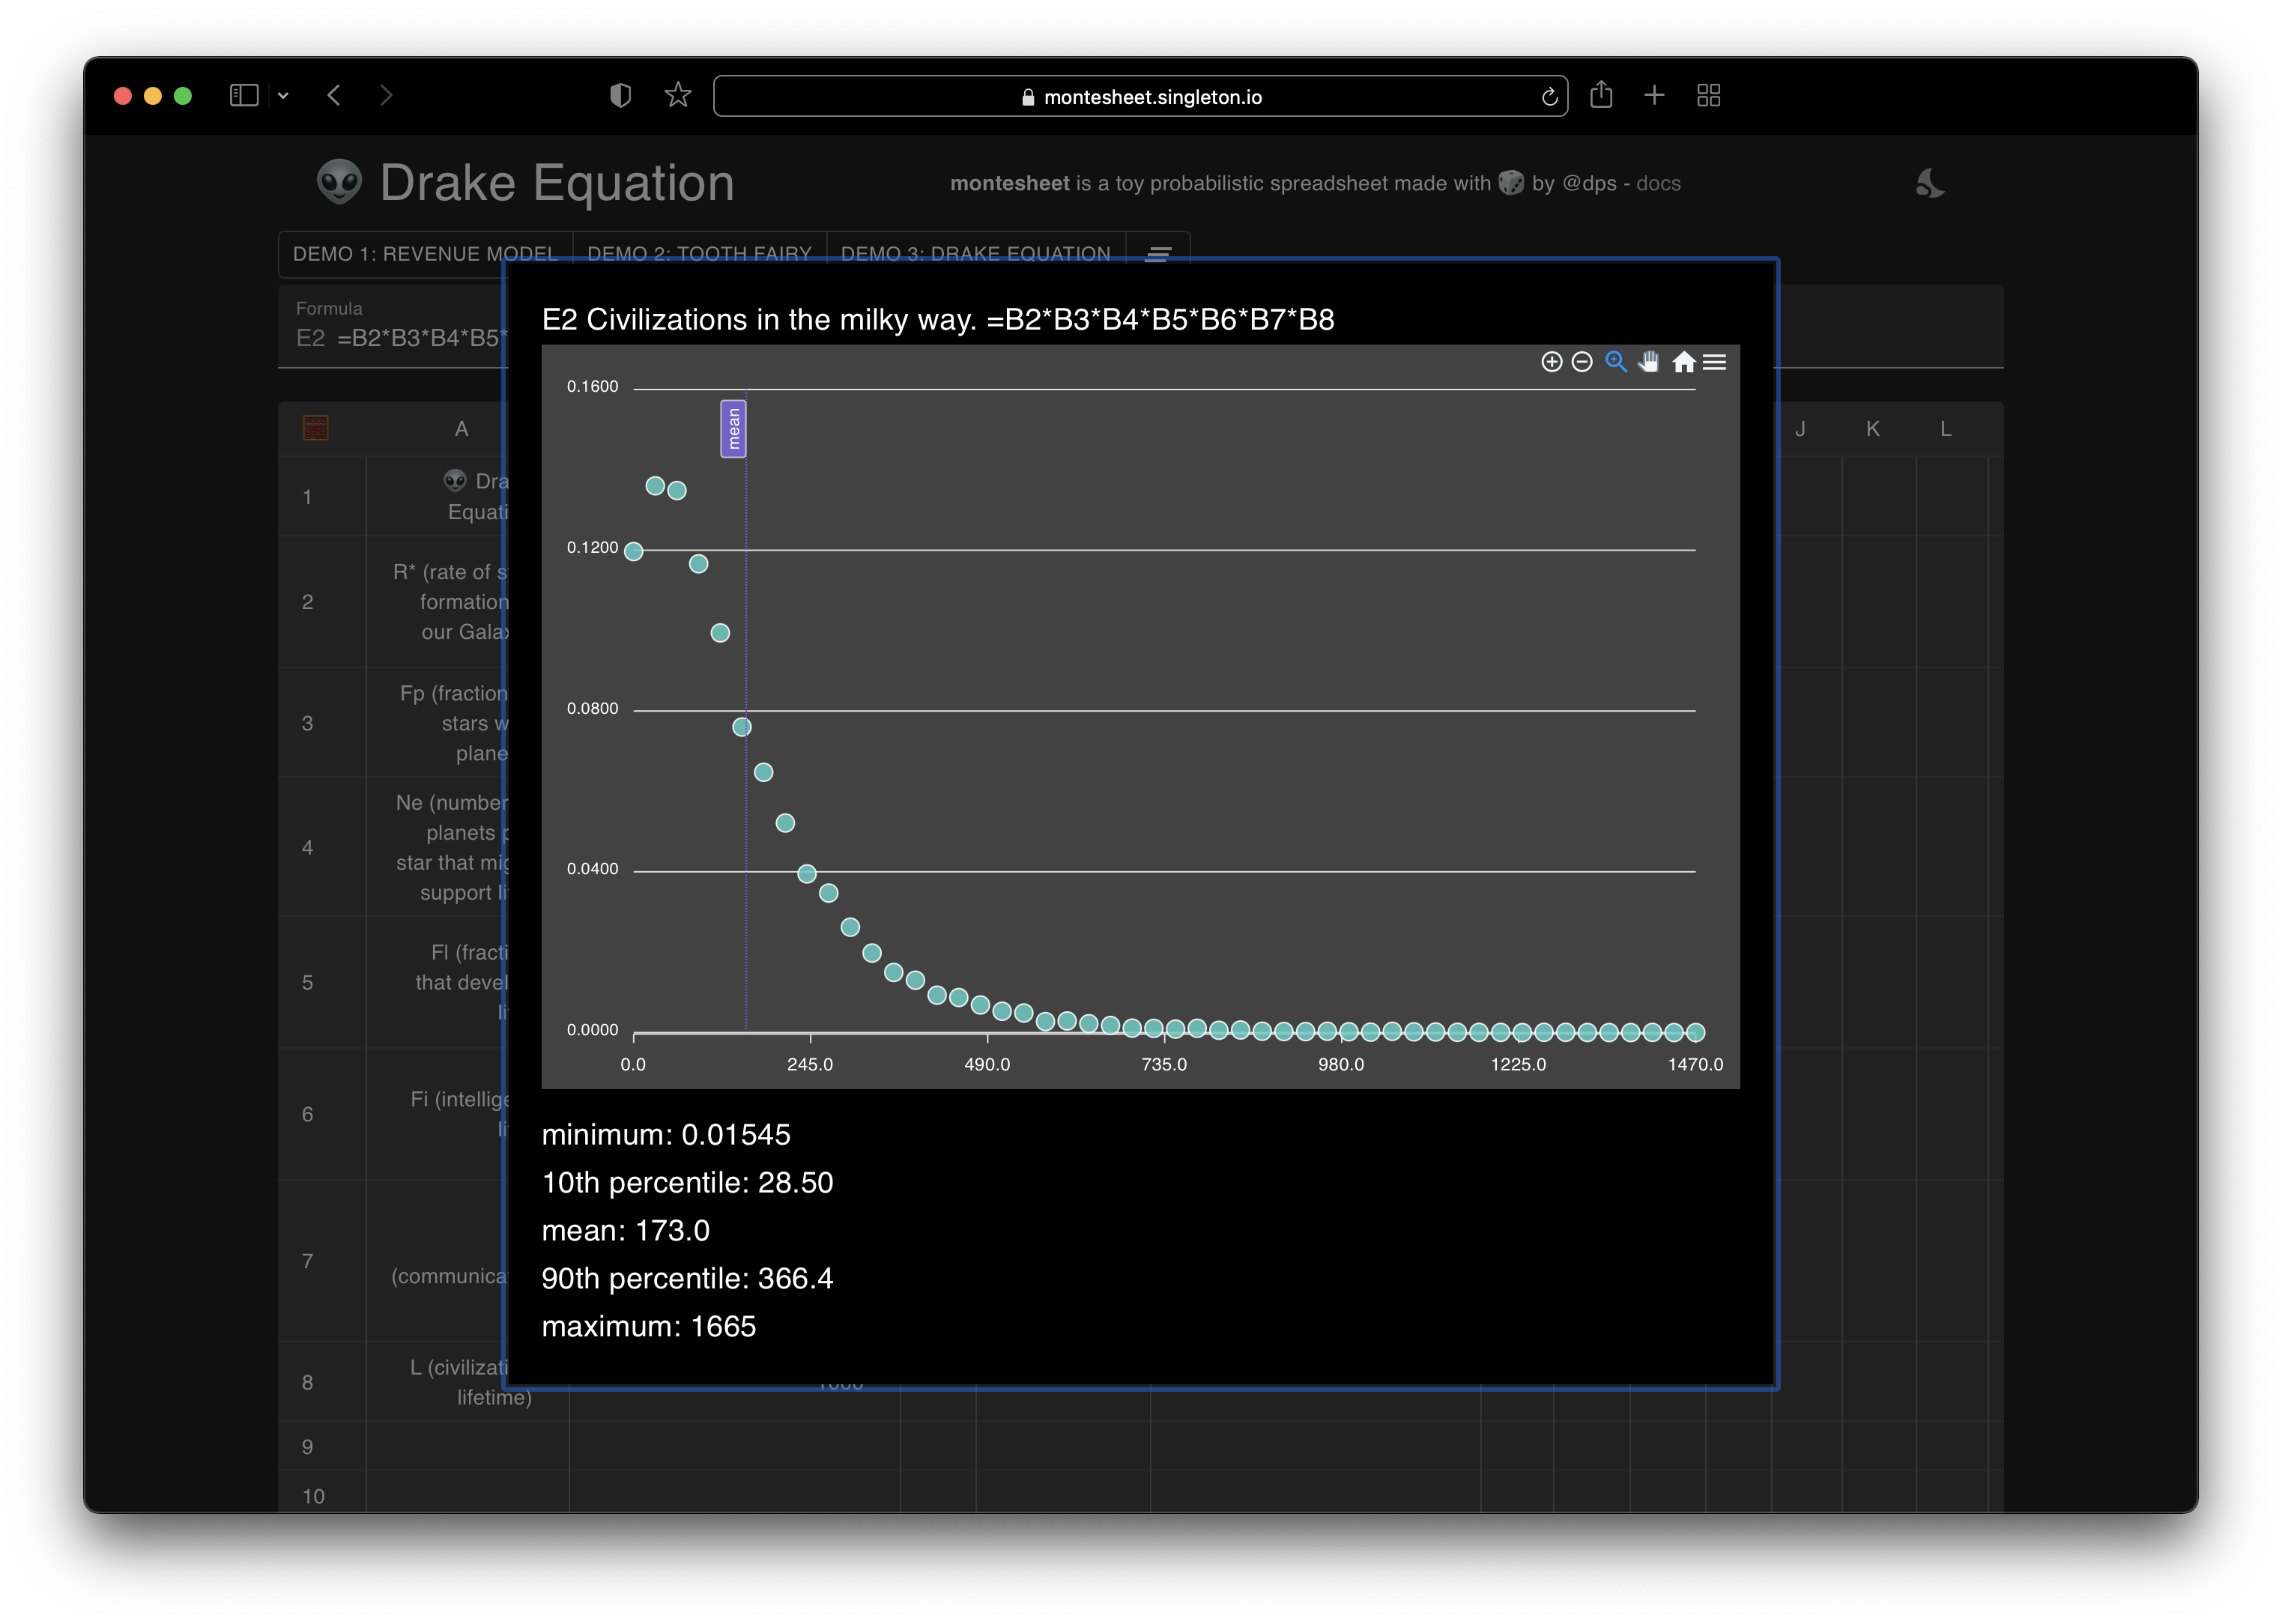
The formula for the number of civilizations doesn’t change - it’s just the product of all the terms =B2*B3*B3*B4*B5*B6*B7*B8, but now that each term is itself a distribution we run 7 Monte Carlo simulations - each grabbing a random sample from each side of the * sign and produce the final result you can see below. We learn that the mean number of civilizations is still approx 170 but the most likely number is about 60 and there’s a long tail of higher probable values.
Try it
It’s feels quite powerful to be able to directly model thousands of scenarios simultaneously. Don’t just take my word for it - you can play with the demo at montesheet.singleton.io. The documentation explains the formulae for all the distribution types and distribution -> scalar functions available. Finally the code is available on Github if you’d like to extend or enhance it.